
Big Brother is watching – behind the scenes of your website
When Hugo and Daphne sit down over a glass of red wine-slime to discuss the latest ideas on how to improve their monster business, Daphne is always very impressed at Hugo’s detailed knowledge about their website and its visitors. Hugo can tell Daphne how many people visited their website, what pages they viewed and even where they live! She thinks it is a little bit spooky, but never questions it as Hugo’s insights are always so valuable. He uses the data to make adjustments to the website, which always create better results!
So how does Hugo know? How does he access all these details about their website and its visitors while running a business and a family? Has he got special monster powers?
While Hugo would love you to think that he does have special powers, it’s much easier than that. He uses a tool called Google Analytics that he installed on their website which is constantly running in the background, doing all the work for him and it can do the very same for you!
**Wondering who Hugo and Daphne are? Read our other blog posts to follow our mascot’s love story here.
What is Google Analytics?
Google Analytics is a free service offered by Google for website owners. It is a powerful tool that gives you access to detailed statistics of your website’s performance and its visitors. It is full of valuable data as Google’s clever spies watch every click your visitors take on your website. Google Analytics helps you, as a business owner, get a better understanding of what’s happening behind the scenes of your website, how visitors interact with your online information and therefore how to get the most leverage from your website.
How does Google Analytics work?
When our minions build your website, they add a little snippet of HTML-code to your website that allows Google to track every visitor on your website. Google’s spies scan each website visitor from top to bottom with their x-ray glasses. They are so good, they can see what device they are using, their location, which pages they look at and what buttons they click on while navigating your website (and much much more). All the data that is collected during those scans, is fed into your Google Analytics account and is free to access. These stats and figures can be pretty overwhelming as Google fills your account with an endless amount of data.
To help keep it simple, on the 1st of every month we email you a pdf snapshot of some of the most important stats. Then every 6 months we contact you for your free website review where we can dive deeper into the more valuable insights. And of course, we can give you access to your Analytics account at any time. Claim your free website review here – this offer is available to anyone!
Why is it crucial to use Google Analytics?
If you have invested in a website and use online marketing strategies such as social media or AdWords, you will want to know how these investments are performing, and that you are getting a good return on investment. With Google Analytics, you can check how your website is performing, how your online marketing is working, and most importantly make the necessary adjustments to improve your results!
Google will tell you:
- How many people visit your website and how long they stay for
- If they are local or international visitors
- What type of device they use to visit your website
- Which pages they look at on your website and in what order
- What the most popular pages are
- And where your traffic comes from?
- Google search
- Other websites
- Yellow pages online etc.
Having a closer look at all these stats, allows you to adjust your website’s content to what your customers are looking for. Creating an unforgettable user experience and converting your website’s visitors to new customers.
How to decipher your Analytics report
On the first of every month we send you/our customers a basic report in pdf form, like the image shown below. Read on for a more detailed explanation that will help you read and understand your monthly reports better.
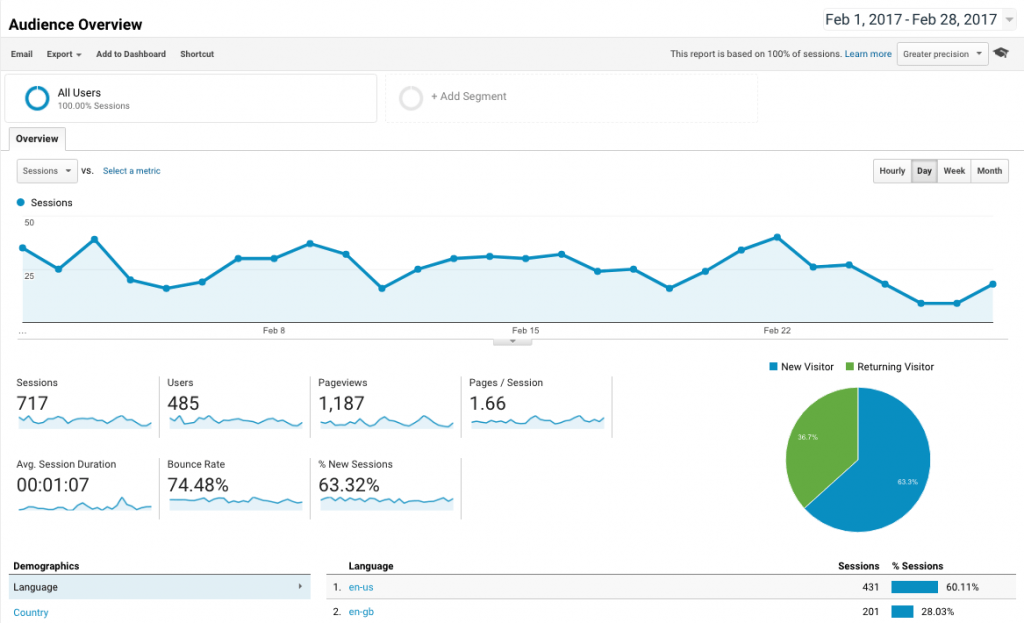
- Sessions: equals website visits. In the above example, the website has been visited 717 times. If one person/User (Hugo) visits your page twice in a day this counts as two sessions.
- Users: means visitors as in actual person who visited your website. 485 is the number of people that have visited our above shown example website. If we keep using Hugo as example: He has visited your website twice in one day (session) and this only counts as one User.
- Pageviews: 1187 is the total number of pages that has been viewed by all the users during their sessions. When Hugo surfs your website, and starts on your Home page, navigates to your About page and then back to your Home page, you will get 3 pageviews.
- Page / Session: 1.66 is the average number of pages viewed during a session. Looking at the figures above, this website had 717 sessions and 1187 pageviews in February. This means on average 1.66 pages have been visited during each session, not per user. (1187 pages / 717 sessions = 1.66)
- Session Duration: 00:01:07 represents the average duration of a session in minutes and seconds. If Hugo’s first visit lasts 2 minutes, and his second visit only 1 minute you will get the result for an average session duration of 00:01:30 minutes (3 minutes divided by 2 visits equals 01:30 minutes, again this is per session not per user/person).
- Bounce Rate: 74.48% bounce rate, is the percentage of all sessions where users only viewed a single page without clicking through to another page, they “bounced” off . A bounce is deemed negative because your visitor has not engaged with your content by clicking through to another page.
- % New Sessions: 63.23% represents the percentage of first time visitors to our sample website as opposed to returning visitors.
- Language: This does not tell you the country that people visit your website from, but is simply the language they have as setting in their browser. You will most likely see, US and GB followed by NZ. I assure you, most of the “US” traffic, will still be users visiting your page from NZ.
What do I need to watch out for?
Ultimately you want all your numbers to go up or roughly stay the same each month. If you have a seasonal business, don’t panic as this will be reflected in these stats too. The only data we want to see shrink, is the bounce rate. A bounce rate below 65% is great, once we go above 75% we will need to take a closer look. You can always give us a call if you are unsure about your analytics report.
6-monthly website reviews
When we catch up for our 6-monthly website reviews, we take a closer-look into your Google Analytics data. We will look at your users, and what type of devices they are using to visit your site, which pages they look at most and how they navigate your site. If we discover any kind of issue or optimization possibilities during this in-depth research session, we will investigate and suggest measures to improve. Monster Graphics works with you to make your website a high performing marketing tool that gets new customers through your door. If you are running Google AdWords, we can see how your Ads perform and optimize those as well.
As you can see there is a lot more to Google Analytics than just the pdf reports we send you each month. Make sure you claim your free 6-monthly website review to get a deeper look behind the scenes of your website and understand who your website visitors and future customers are!
Claim your website review with Monster Graphics here – this offer is available to all website owners, you don’t have to be a Monster Graphics customer.